Chemometric Investigation of Polarization Curves: Initial Attempts
Outline Polarization Curves Data Methods Results Future Work Definition and Terms Motivation for Chemometric Approach Differences from Spectroscopic Data Data Methods Results Future Work Acknowledgements
Chemometric Investigation of Polarization Curves: Initial Attempts
Christopher A. Marks. Center for Electrochemical Science and Engineering. University of Virginia. Charlottesville, VA – USA.
Definition and Terms. Motivation for Chemometric Approach. Differences from Spectroscopic Data. Data. Methods. Results. Future Work. Acknowledgements.
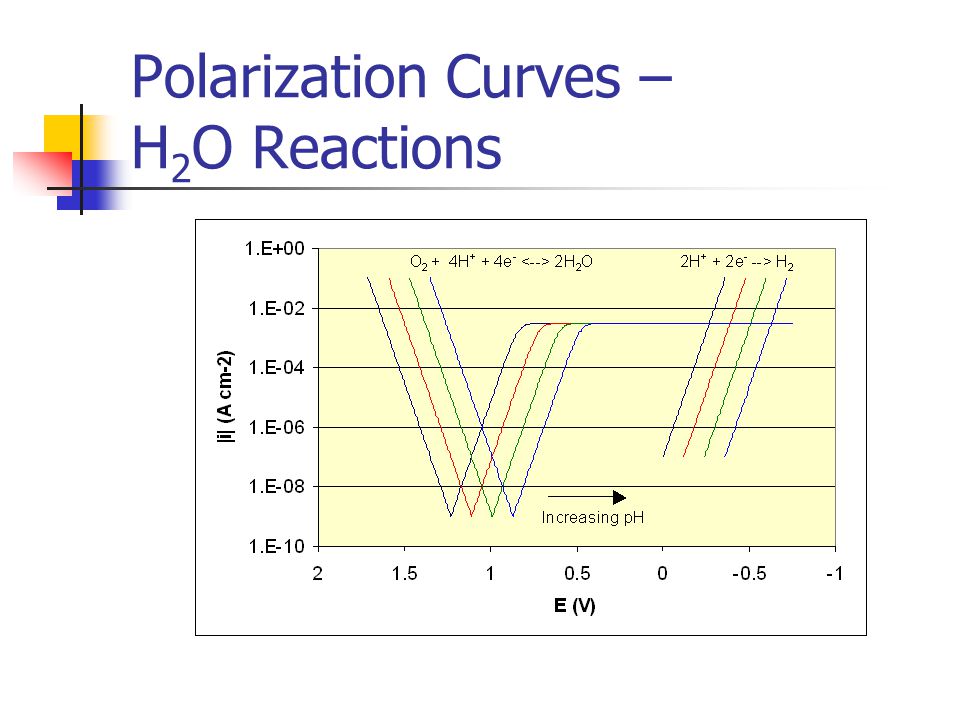
Electrochemical measurements of net current density (i (A cm-2)) as a function of potential (E (V)) for a given electrolyte and working electrode. E versus some reference electrode. Importance of net current. i and log(|i|)
E versus some reference electrode. i and log(|i|) Exchange current density can change. Diffusion limited current density changes as a function of [O2], pH and stirring, etc.
Exchange current density can be a function of electrolyte. Alloys are more complicated than a pure metal, non-stoichiometric dissolution. Passivity is more complex than indicated.
inet = ianodic + icathodic. M Mn+ + ne- 2H20 O2 + 4H+ + 4e- O2 + 4H+ + 4e- 2H2O. Only a small fraction of what is of interest can be measured experimentally. Net curve is offset slightly for clarity. E versus some reference electrode. Importance of net current. Define Eoc, Ep, and ipass.
Resolve net current data into components which are simple functions of pH, [Cl-], [O2], [Mn+], etc. so that the important parameters, Eoc, Ep, and ipass, can be optimized or interpolated. Compare to anova, etc. of values picked from curves.
Non-constant domain (non-random missing data) Variable uncertainty in i, depends on i, not E. How to calculate 2 Discuss how uncertainty in i is a function of i,
240 (partial) polarization curves – 8 shown.
No mean-centering or scaling. Missing values replaced by estimates (Xestij=tipj) Iteratively re-weighted least squares. Estimate loadings (p=(t’t)-1t’X) Calculate variable weights (v) based on p (vi = # obs / (a priori uncertainty for pi)2. Estimate scores (t=Xdiag(v)p’(pdiag(v)p’)-1) Go to 1, until convergence. Orthogonalize p with respect to the previous P.
Several outliers identified and removed. Algorithm is slow to converge. First factor.
Results 6 component residuals are bothersome, not making progress but still large residuals
Verify target function and weighting. Non-orthogonal P. Simulated data. Smaller/simpler data sets. Non-negative T (P ) and/or Rotations. PLS and other techniques. Time series. EIS, 3-way Spatial electrode arrays.
B.A. Kehler, G.O. Ilevbare, J.R. Scully, Comparison of the Crevice Corrosion Resistance of Alloys 625 and 22, CORROSION/2000, paper no. 182, NACE, B.A. Kehler, Crevice Corrosion Electrochemistry of Alloys 625 And C22, University of Virginia, Charlottesville, January, John Scully, Rob Kelly, et al. – CESE. Jack McArdle – UVa Psychology. WSC1 presenters and participants.

Integrated plasma metabolomics and lipidomics profiling highlights distinctive signature of hepatocellular carcinoma in HCV patients, Journal of Translational Medicine
My Russian Adventures Christopher A. Marks 22 February, ppt download
ACP - Relations - Measurement of the collision rate coefficients between atmospheric ions and multiply charged aerosol particles in the CERN CLOUD chamber

Combining UAV-based hyperspectral imagery and machine learning algorithms for soil moisture content monitoring [PeerJ]

Including trilinear and restricted Tucker3 models as a constraint in Multivariate Curve Resolution Alternating Least Squares Romà Tauler Department of. - ppt video online download
AAS News Archives - Page 3 of 19 - AAS Nova

Chemometric Investigation of Polarization Curves: Initial Attempts - ppt video online download

Full article: Early Diagnosis of Mercury Stress of Wheat Seedlings Using Attenuated Total Reflection Fourier Transform Infrared Spectroscopy
How do defects and minor solute control the corrosion properties of solid solution alloys? Investigation of the effects of structural (order – disorder. - ppt download
Potentiodynamic polarization curves of AA7075 at high scan rates interpreted using the high field model

Chemometric Investigation of Polarization Curves: Initial Attempts - ppt video online download

Including trilinear and restricted Tucker3 models as a constraint in Multivariate Curve Resolution Alternating Least Squares Romà Tauler Department of. - ppt video online download